How to Plot Polar Coordinates
Introduction
Polar coordinates are an alternative coordinate system to the commonly used Cartesian (rectangular) coordinates. They are particularly useful in situations where data can be more easily represented using a distance from a central point and an angle, rather than horizontal and vertical distances. In this article, we will discuss how to plot polar coordinates and provide a step-by-step guide to help you master this skill.
Basics of Polar Coordinates
Polar coordinates use a central point called the pole (or origin) and an initial line called the polar axis. In contrast to Cartesian coordinates, which express points using two values (x, y), polar coordinates represent points using two values: the radial distance (r) and the angle (θ). The radial distance measures the distance between the point and the pole, while the angle is measured counterclockwise from the polar axis.
Plotting Polar Coordinates
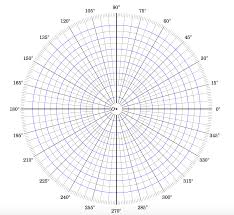
1.Prepare your tools: To plot polar coordinates, you’ll need graph paper with concentric circles drawn at regular intervals, representing radial distance (r). Additionally, you’ll need a protractor for measuring angles and a ruler for drawing lines.
2.Identify your point: Locate the polar coordinate you want to plot – for example, P(r, θ). Make sure that you have both of its components: the radial distance (r) and the angle (θ).
3.Plot radial distance: Using your ruler or compass, measure the radial distance from the pole based on your graph paper scale. If your graph shows circles representing increments of 1 unit each and your point has a radial distance of 3 units, locate where 3 circles away from the pole is.
4.Measure angle from polar axis: Next, use your protractor to measure θ degrees counterclockwise from the polar axis. For instance, if θ is 45 degrees, place the protractor’s center on the pole and rotate the angle marker until you read 45 degrees counterclockwise from the polar axis.
5.Mark your point: Starting at the intersection of your polar axis and radial distance circle, draw a straight line toward the center of your protractor along θ degrees. Where this line intersects your chosen radial distance, mark point P – this is the plot of your polar coordinate.
6.Label your point: To keep track of plotted points and to easily reference back to them, label the point with its coordinate (r, θ).
7.Repeat for additional points: If you have more polar coordinates to plot, follow the same steps for each of them.
Conclusion
Plotting polar coordinates allows us to represent data using an alternative coordinate system that’s beneficial in various scenarios. By following these simple steps and practicing regularly, you’ll master plotting polar coordinates in no time. Happy graphing!