
How to calculate ic50
Introduction:
The concept of IC50 (half maximal inhibitory concentration) is an essential parameter in pharmacology. It measures the effectiveness of a substance in inhibiting a specific biological function or a pathogen and provides critical information for drug development research. This article will guide you through the process of calculating IC50, including its importance and typical methodologies used.
Importance of IC50:
IC50 represents the concentration of a drug or compound at which 50% of the intended activity is inhibited. This value indicates how potent a drug is, allowing researchers to compare the effectiveness of different compounds against specific targets. High potency drugs display lower IC50 values, indicating that less concentration is required to achieve 50% inhibition. This information is critical in determining the optimal dosage for drug administration, predicting side effects, and making choices in drug discovery programs.
Methods for Calculating IC50:
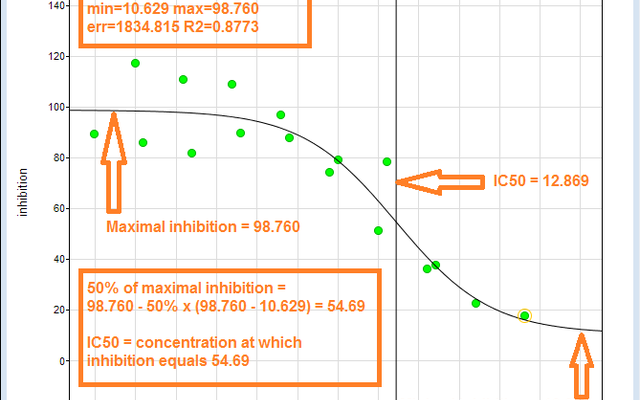
1. Dose-Response Curve:
The most common method for calculating IC50 involves generating a dose-response curve. This curve plots the percentage of inhibition against the logarithm of compound concentrations. The process involves these steps:
– Prepare several dilutions of the test substance to determine its concentration range.
– Apply each dilution to the biological system or assay.
– Measure the response (such as enzyme activity or cell viability) at each concentration.
– Plot the data points on a graph with percentage response on Y-axis and log concentration on X-axis.
– Fit a sigmoidal dose-response curve to the experimental data points.
– Determine the corresponding compound concentration on X-axis at 50% inhibition.
2. Software Calculations:
Many contemporary software tools can directly calculate IC50 values based on input datasets. Examples include Prism by GraphPad, Origin, SigmaPlot, or Excel add-ons like XLfit and Hill Slope Calculator. Simply input raw data (compound concentrations and responses) into the software and follow the specific tool’s instructions to obtain the IC50 value.
3. Four Parameter Logistic Model (4PL):
This method is a widely-used mathematical approach to fit the dose-response curve and calculate IC50. It involves a non-linear regression of response data using four parameters:
– Background response level (minimal response)
– Maximum response level (maximal response)
– Hill’s slope (the steepness of the curve)
– IC50 value
The 4PL model is carried out using specialized software or programming languages like R or Python. It delivers precise IC50 values and can accommodate more complex dose-response relationships.
Conclusion:
Calculating IC50 provides essential information for determining drug effectiveness and optimizing drug development pipelines. By understanding how to create dose-response curves, utilize software tools, or apply complex models like 4PL, researchers can confidently determine IC50 values and make informed decisions about prospective drug candidates.


